skip to main
|
skip to sidebar
The Collection of a Map Apprentice
FSU student trying to learn the multifaceted usage of maps and what they mean. Wish me luck!! =)
Friday, April 23, 2010
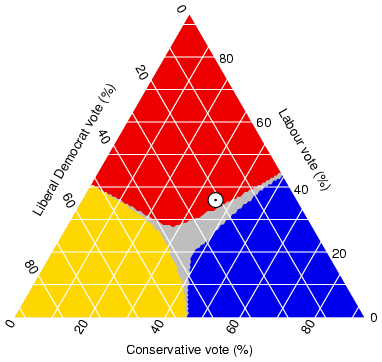
21. Triangular Plot
Source
This plot graphically depicts three different ratios and where they intersect is the constant. The white circle represents the point of a certain election and where it stand in regards to the type of votes.
No comments:
Post a Comment
Newer Post
Older Post
Home
Subscribe to:
Post Comments (Atom)
Followers
Blog Archive
▼
2010
(53)
▼
April
(53)
53. Bathymetry Map
52. Hypsometric Maps
51. Ideogram
50. Isoline Map
49. Topographic Map
48. Line Graph
47. Magnetic Resonance Imaging
46. Nominal Area Choropleth Map
45. Isopleth
44. GIS Map
43. Isohyets
42. Lorenz Curve
41. Index Value Plot
40. Conformal Projections
39. Flow Map
38. Kriging
37. Proportional Circle Map
36. Data Visualization
35. Statistical Map
34. Concept Map
33. Multivariate Map
32. Parallel Coordinate Map
31. DOQQ
30. Dot Distribution Map
29. Cartogram
28. Climograph
27. Cadastral Map
26. Star Plot
25. B&W Aerial Photos
24. DRG
23. Box Plot
22. LIDAR
21. Triangular Plot
20. Unclassed Choropleth Map
19. Classed Choropleth Map
18. PLSS
17. Contour Map
16. Mercator Projections
15. Histogram
14. Windrose
13. Doppler Radar
12. Propaganda Map
11. Similarity Matrix
10. Areal Pattern Analysis
9. Bilateral Graph
8. Line Maps
7. Photographs
6. DEM
5. Scatter Plot
4. Stem & Leaf Plot
3. Population Pyramid
2. Isobars
1. Mental Map
About Me
PerksS87
View my complete profile
No comments:
Post a Comment